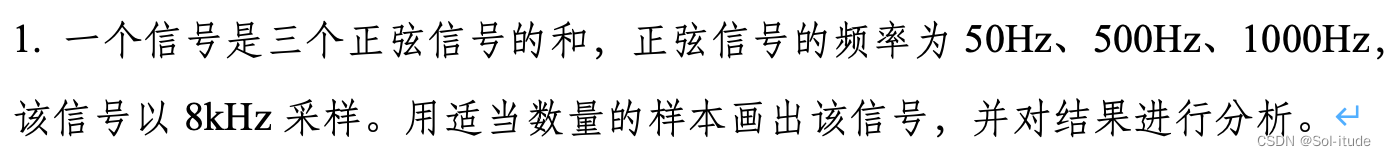
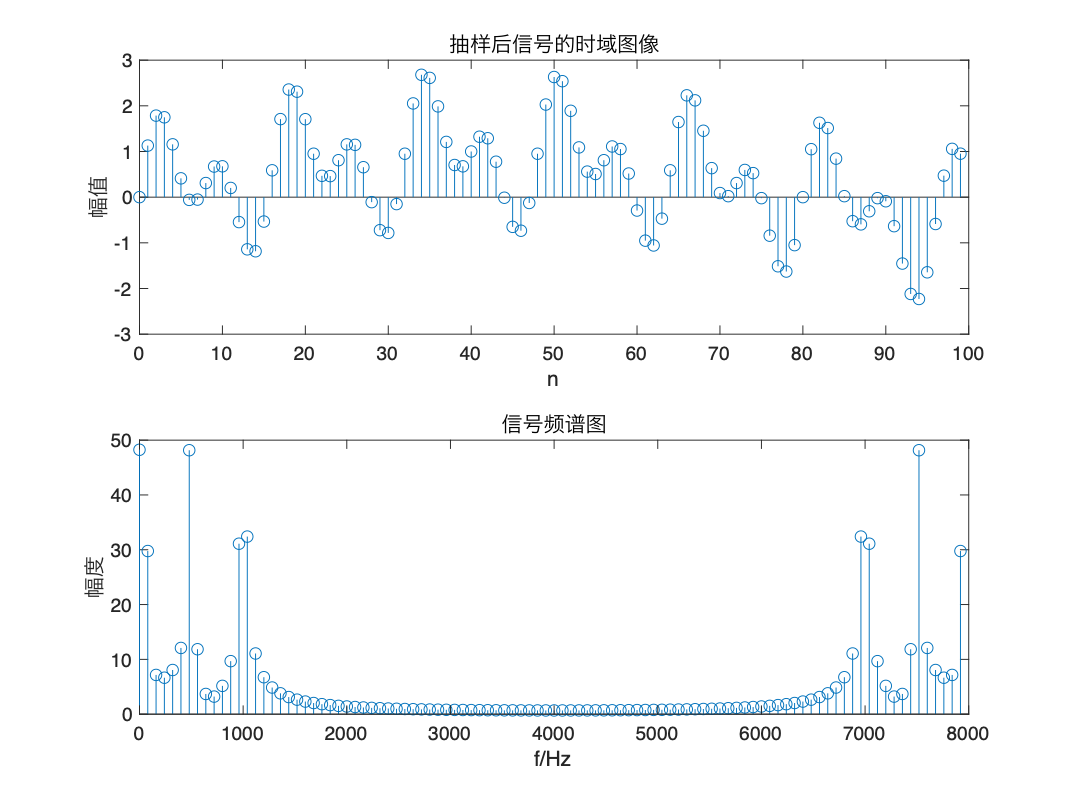
1
2
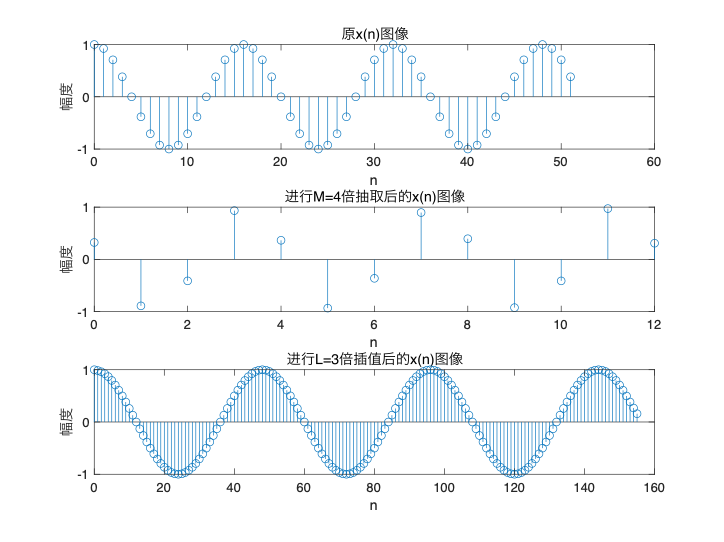
3
4
5
6
7
8
9
10
11
12
13
14
15
16
17
18
19
20
21
22
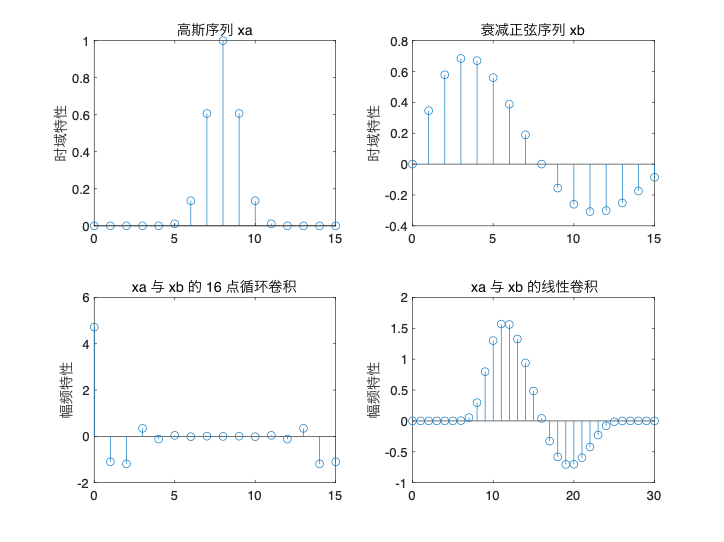
| clc;
n1=0:1:15;
n2=0:1:30;
p=8;q=2;
a=0.1;f=0.0625;
xa=exp(-((n1-p).^2)/q);
xb=exp(-a.*n1).*sin(2*pi*f.*n1);
fa=fft(xa);
fb=fft(xb);
circle=fa.*fb; %圆周卷积
line=conv(xa,xb); %线性卷积
subplot(2,2,1);
stem(n1,xa);ylabel('时域特性');title('高斯序列 xa');
subplot(2,2,2);
stem(n1,xb);ylabel('时域特性');title('衰减正弦序列 xb');
subplot(2,2,3);
stem(n1,circle);ylabel('幅频特性');title('xa 与 xb 的 16 点循环卷积');
subplot(2,2,4);
stem(n2,line);ylabel('幅频特性');title(' xa 与 xb 的线性卷积');
|