1
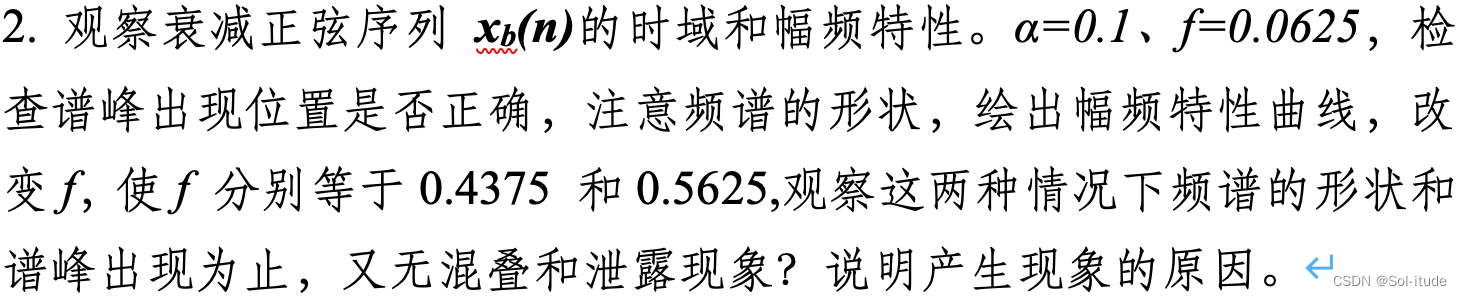
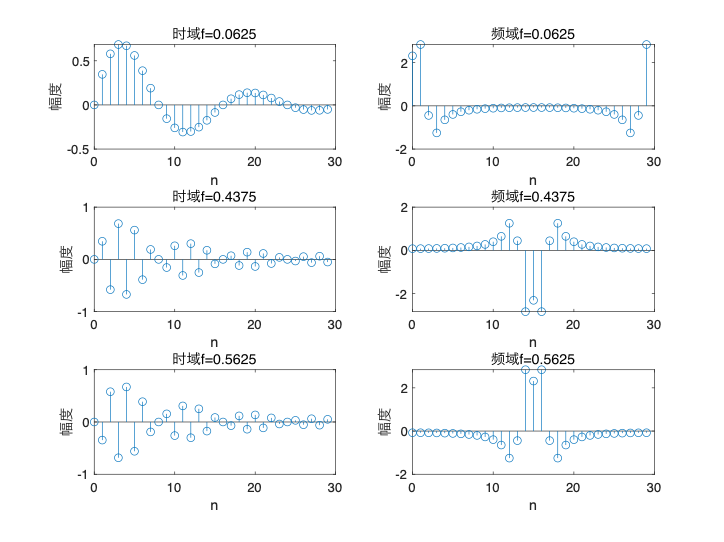
2
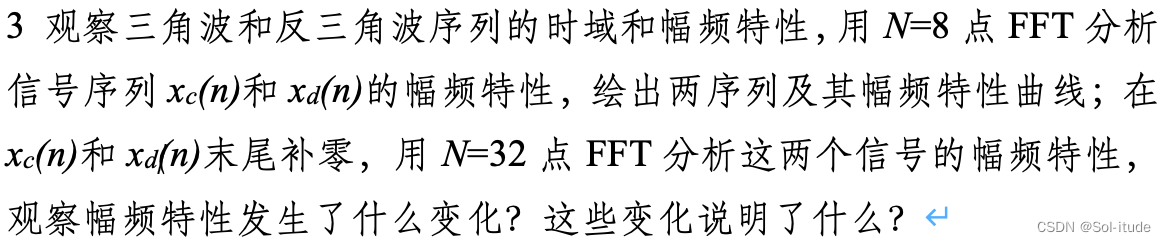
3
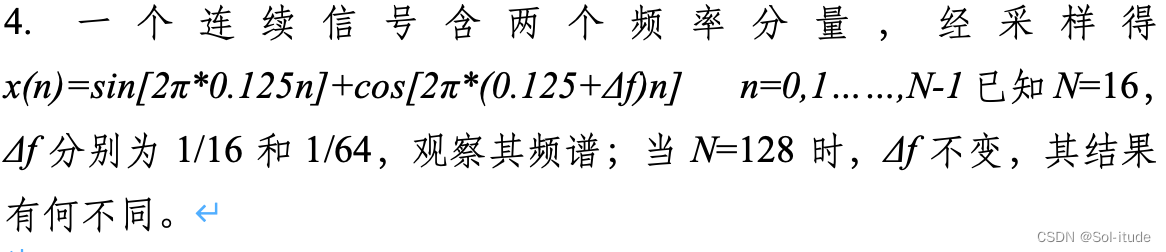
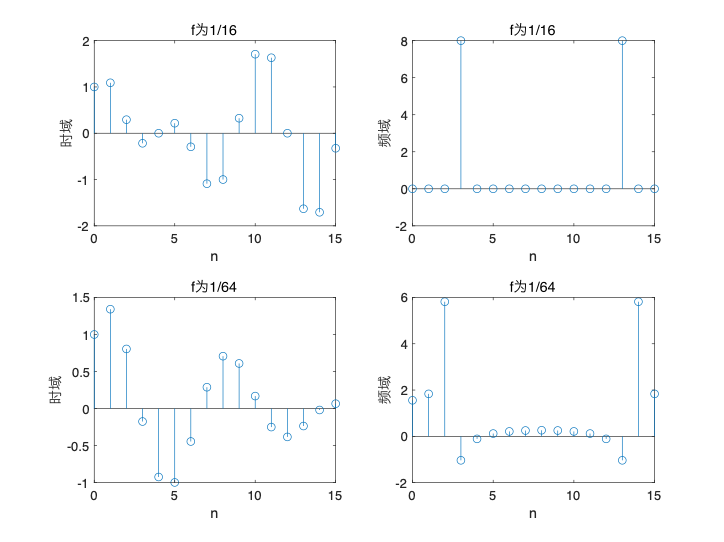
4
5
6
7
8
9
10
11
12
13
14
15
16
17
18
19
20
21
22
23
24
25
26
27
28
29
30
31
32
33
34
35
36
37
38
39
40
41
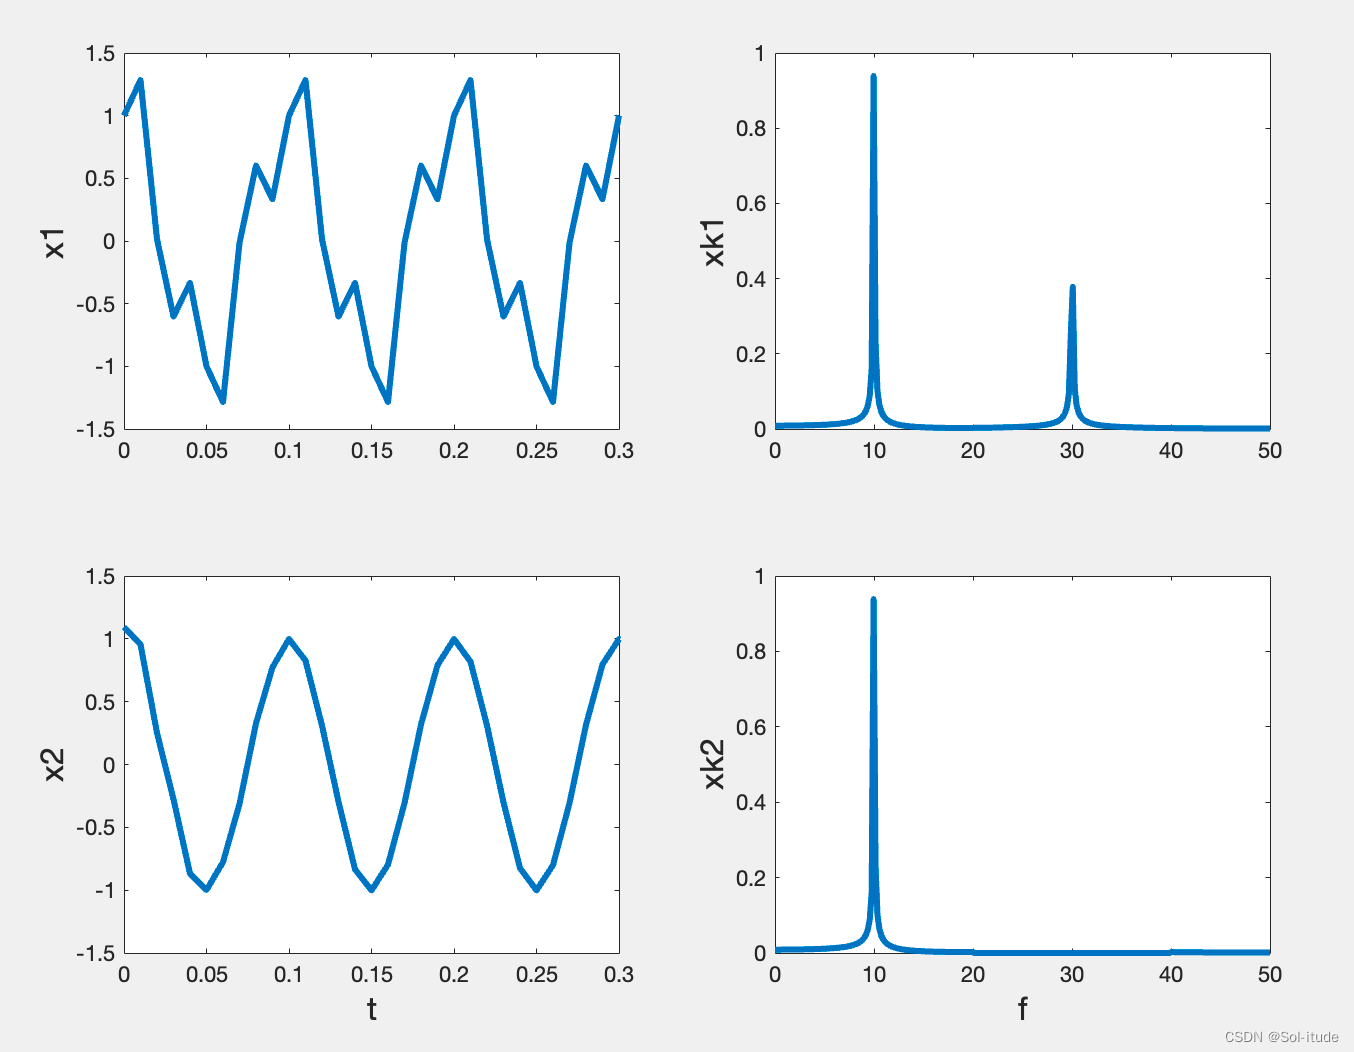
| dt=0.01;
N=512;
n=0:N-1;
t=n*dt;
f=n/(N*dt);
f1=30;
f2=10;
x=0.5*sin(2*pi*f1*t)+cos(2*pi*f2*t);
x1=x;
subplot(2,2,1)
plot(t,x1,'linewidth',3);
ylabel('x1','fontsize',16);
xlim([0 0.3])
y=fft(x);
xk1=abs(y)*2/N;
subplot(2,2,2)
plot(f,xk1,'linewidth',3);
ylabel('xk1','fontsize',16);
xlim([0 50])
f1=20;
f2=40;
yy=zeros(1,length(y));
for m=0:N-1
if(m/(N*dt)>f1&m/(N*dt)<f2)|(m/(N*dt)>(1/dt-f2)&m/(N*dt)<(1/dt-f1))
yy(m+1)=0.;
else
yy(m+1)=y(m+1);
end
end
xk2=abs(yy)*2/N
subplot(2,2,4)
plot(f,xk2,'linewidth',3);
xlim([0 50]);
xlabel('f','fontsize',16);
ylabel('xk2','fontsize',16);
x2=real(ifft(yy));
subplot(2,2,3)
plot(t,x2,'linewidth',3);
xlabel('t','fontsize',16);
ylabel('x2','fontsize',16);
xlim([0 0.3])
|