Sorry, your browser cannot access this site
This page requires browser support (enable) JavaScript
Learn more >

MengFanjun的博客

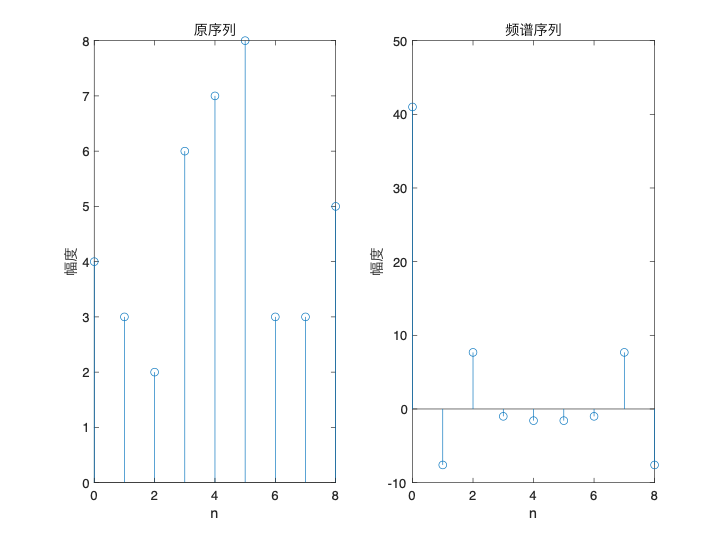
在这里插入图片描述 这题原本画出来就四条谱线,除了频率0的直流分量,就三根了,太少了,为了看着方便,我自己增加了序列

1
2
3
4
5
6
7
8
9
10
11
12
13
clear
close all
clc

n=0:8;
x=[4 3 2 6 7 8 3 3 5];
subplot(1,2,1);
stem(n,x)
xlabel('n');ylabel('幅度');title('原序列');
y=fft(x);
subplot(1,2,2);
stem(n,y);
xlabel('n');ylabel('幅度');title('频谱序列');

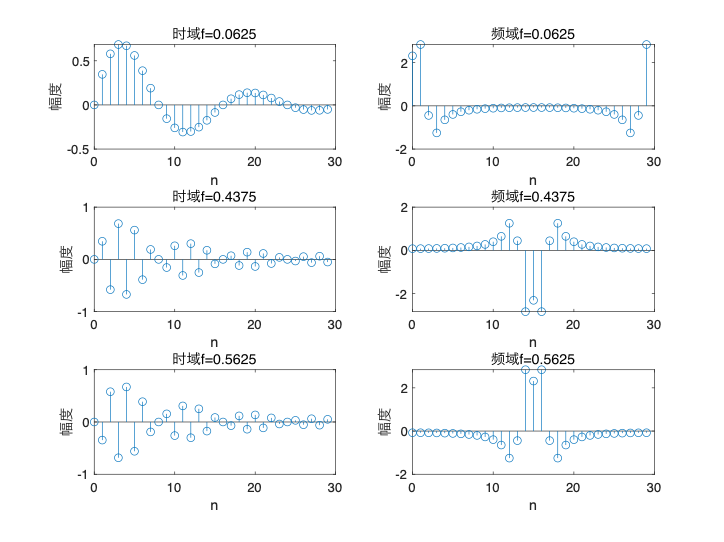
在这里插入图片描述 除了频率0,剩下的幅度一样,相位取反 在这里插入图片描述

1
2
3
4
5
6
7
8
9
10
11
12
13
14
15
16
17
18
19
20
21
22
23
24
25
26
27
28
29
30
31
32
33
34
35
36
clear
close all
clc

n=0:29;
a=0.1;
f1=0.0625;
f2=0.4375;
f3=0.5625;
x1=exp(-a.*n).*sin(2*pi*f1.*n);
x2=exp(-a.*n).*sin(2*pi*f2.*n);
x3=exp(-a.*n).*sin(2*pi*f3.*n);

subplot(3,2,1);
stem(n,x1);
xlabel('n');ylabel('幅度');title('时域f=0.0625');
y1=fft(x1);
subplot(3,2,2);
stem(n,y1);
xlabel('n');ylabel('幅度');title('频域f=0.0625');

subplot(3,2,3);
stem(n,x2);
xlabel('n');ylabel('幅度');title('时域f=0.4375');
y2=fft(x2);
subplot(3,2,4);
stem(n,y2);
xlabel('n');ylabel('幅度');title('频域f=0.4375');

subplot(3,2,5);
stem(n,x3);
xlabel('n');ylabel('幅度');title('时域f=0.5625');
y3=fft(x3);
subplot(3,2,6);
stem(n,y3);
xlabel('n');ylabel('幅度');title('频域f=0.5625');

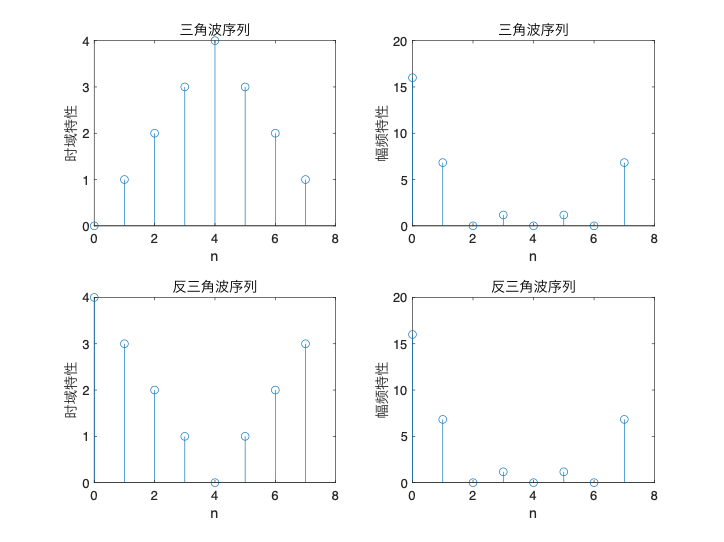
在这里插入图片描述 在这里插入图片描述

1
2
3
4
5
6
7
8
9
10
11
12
13
14
15
16
17
18
19
20
21
22
23
24
25
26
clear
close all
clc

N=8;
n=0:7;
x1=zeros(size(n));
x2=zeros(size(n));

xa=(n>=0)&(n<=3);
x1(xa)=n(xa);
x2(xa)=4-n(xa);

xa=(n>=4)&(n<=7);
x1(xa)=8-n(xa);
x2(xa)=n(xa)-4;

fp1=fft(x1);
fp1=abs(fp1);
fp2=fft(x2);
fp2=abs(fp2);

subplot(2,2,1);stem(n,x1);xlabel('n');ylabel('时域特性');title('三角波序列');
subplot(2,2,2);stem(n,fp1);xlabel('n');ylabel('幅频特性');title('三角波序列');
subplot(2,2,3);stem(n,x2);xlabel('n');ylabel('时域特性');title('反三角波序列');
subplot(2,2,4);stem(n,fp2);xlabel('n');ylabel('幅频特性');title('反三角波序列');
在这里插入图片描述
1
2
3
4
5
6
7
8
9
10
11
12
13
14
15
16
17
18
19
20
21
22
23
24
25
26
27
28
29
30
31
32
clear
close all
clc

N=8;
n=0:7;
x1=zeros(size(n));
x2=zeros(size(n));

xa=(n>=0)&(n<=3);
x1(xa)=n(xa);
x2(xa)=4-n(xa);

xa=(n>=4)&(n<=7);
x1(xa)=8-n(xa);
x2(xa)=n(xa)-4;
N2=32;
n2=0:31;
tempx1=zeros(1,24);
x11=[x1,tempx1];
tempx2=zeros(1,24);
x22=[x2,tempx2];

fp11=fft(x11);
fp11=abs(fp11);
fp22=fft(x22);
fp22=abs(fp22);

subplot(2,2,1);stem(n2,x11);xlabel('n');ylabel('时域特性');title('补0后三角波序列');
subplot(2,2,2);stem(n2,fp11);xlabel('n');ylabel('幅频特性');title('补0后三角波序列');
subplot(2,2,3);stem(n2,x22);xlabel('n');ylabel('时域特性');title('补0后反三角波序列');
subplot(2,2,4);stem(n2,fp22);xlabel('n');ylabel('幅频特性');title('补0后反三角波序列');

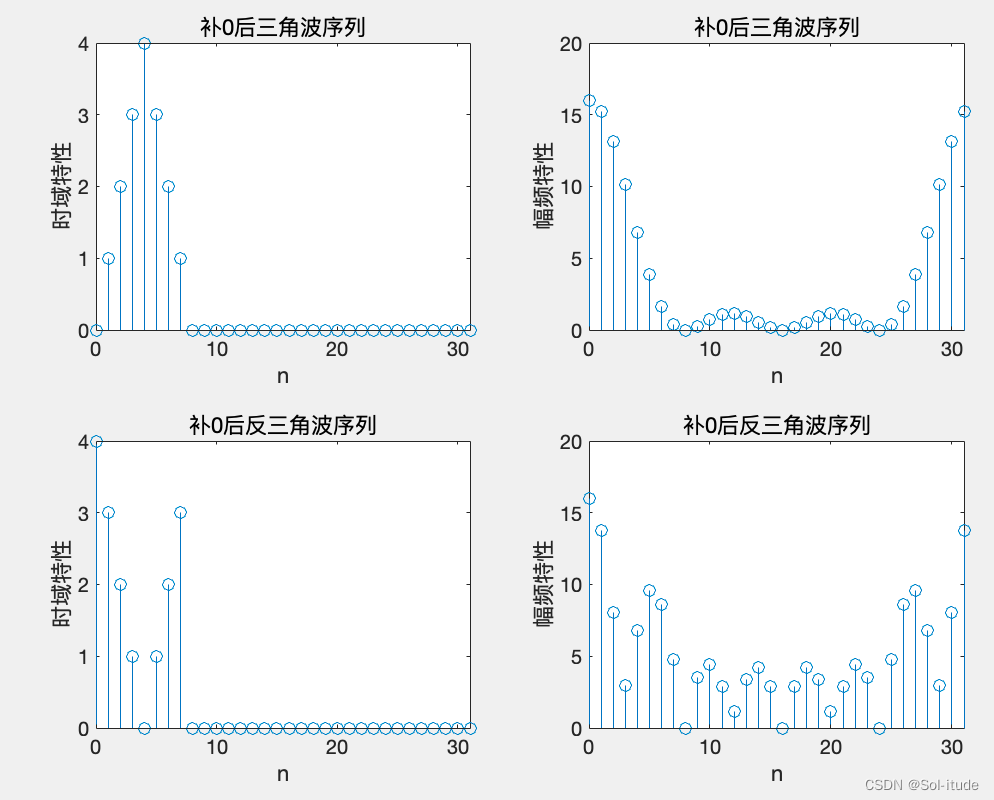
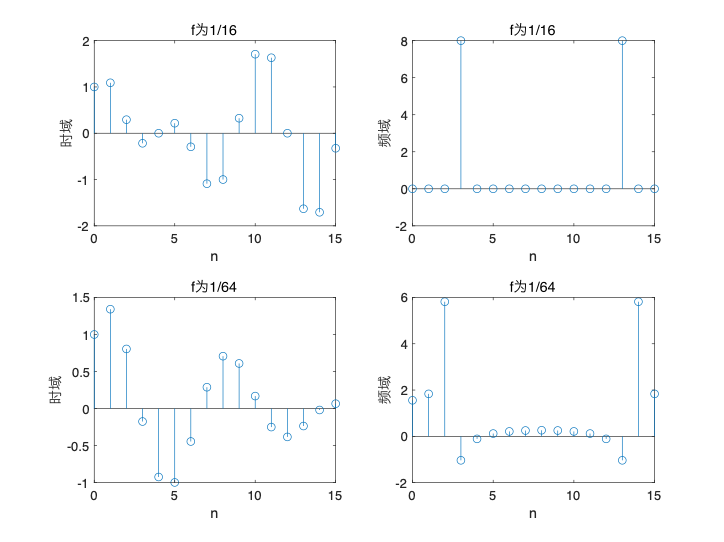
在这里插入图片描述 后面补0,采样点变多了,副频特性要比补0前更清晰 在这里插入图片描述 N=16时

1
2
3
4
5
6
7
8
9
10
11
12
13
14
15
16
17
18
19
20
21
22
23
clear
close all
clc

N=16;
n=0:N-1;
f1=1/16;
f2=1/64;
xn1=sin(2*pi*0.125*n)+cos(2*pi*(0.125+f1)*n);
xn2=sin(2*pi*0.125*n)+cos(2*pi*(0.125+f2)*n);

yn1=fft(xn1);
yn2=fft(xn2);

subplot(2,2,1);
stem(n,xn1);xlabel('n');ylabel('时域');title('f为1/16');
subplot(2,2,2);
stem(n,yn1);xlabel('n');ylabel('频域');title('f为1/16');

subplot(2,2,3);
stem(n,xn2);xlabel('n');ylabel('时域');title('f为1/64');
subplot(2,2,4);
stem(n,yn2);xlabel('n');ylabel('频域');title('f为1/64');
在这里插入图片描述
1
2
3
4
5
6
7
8
9
10
11
12
13
14
15
16
17
18
19
20
N2=128;
n2=0:N2-1;
f1=1/16;
f2=1/64;

xn3=sin(2*pi*0.125*n2)+cos(2*pi*(0.125+f1)*n2);
xn4=sin(2*pi*0.125*n2)+cos(2*pi*(0.125+f2)*n2);

yn3=fft(xn3);
yn4=fft(xn4);

subplot(2,2,1);
stem(n2,xn3);xlabel('n');ylabel('时域');title('f为1/16');
subplot(2,2,2);
stem(n2,yn3);xlabel('n');ylabel('频域');title('f为1/16');

subplot(2,2,3);
stem(n2,xn4);xlabel('n');ylabel('时域');title('f为1/64');
subplot(2,2,4);
stem(n2,yn4);xlabel('n');ylabel('频域');title('f为1/64');

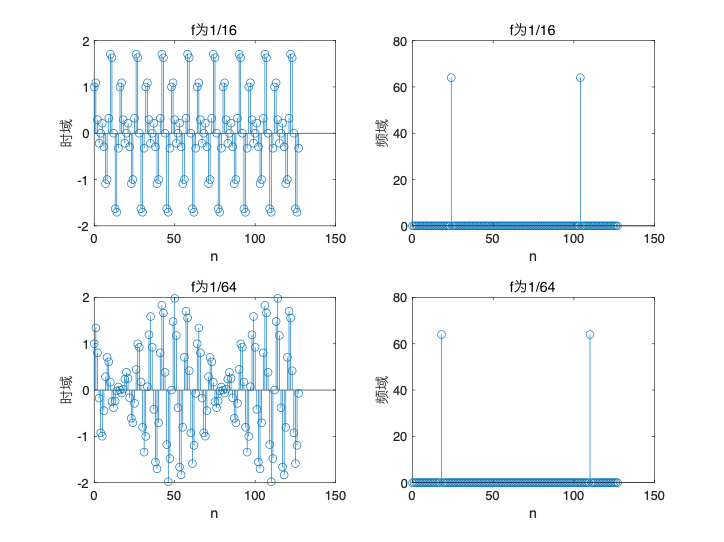
在这里插入图片描述 在这里插入图片描述

1
2
3
4
5
6
7
8
9
10
11
12
13
14
15
16
17
18
19
20
21
22
23
24
25
26
27
28
29
30
31
32
33
34
35
36
37
38
39
40
41
dt=0.01;
N=512;
n=0:N-1;
t=n*dt;
f=n/(N*dt);
f1=30;
f2=10;
x=0.5*sin(2*pi*f1*t)+cos(2*pi*f2*t);
x1=x;
subplot(2,2,1)
plot(t,x1,'linewidth',3);
ylabel('x1','fontsize',16);
xlim([0 0.3])
y=fft(x);
xk1=abs(y)*2/N;
subplot(2,2,2)
plot(f,xk1,'linewidth',3);
ylabel('xk1','fontsize',16);
xlim([0 50])
f1=20;
f2=40;
yy=zeros(1,length(y));
for m=0:N-1
if(m/(N*dt)>f1&m/(N*dt)<f2)|(m/(N*dt)>(1/dt-f2)&m/(N*dt)<(1/dt-f1))
yy(m+1)=0.;
else
yy(m+1)=y(m+1);
end
end
xk2=abs(yy)*2/N
subplot(2,2,4)
plot(f,xk2,'linewidth',3);
xlim([0 50]);
xlabel('f','fontsize',16);
ylabel('xk2','fontsize',16);
x2=real(ifft(yy));
subplot(2,2,3)
plot(t,x2,'linewidth',3);
xlabel('t','fontsize',16);
ylabel('x2','fontsize',16);
xlim([0 0.3])

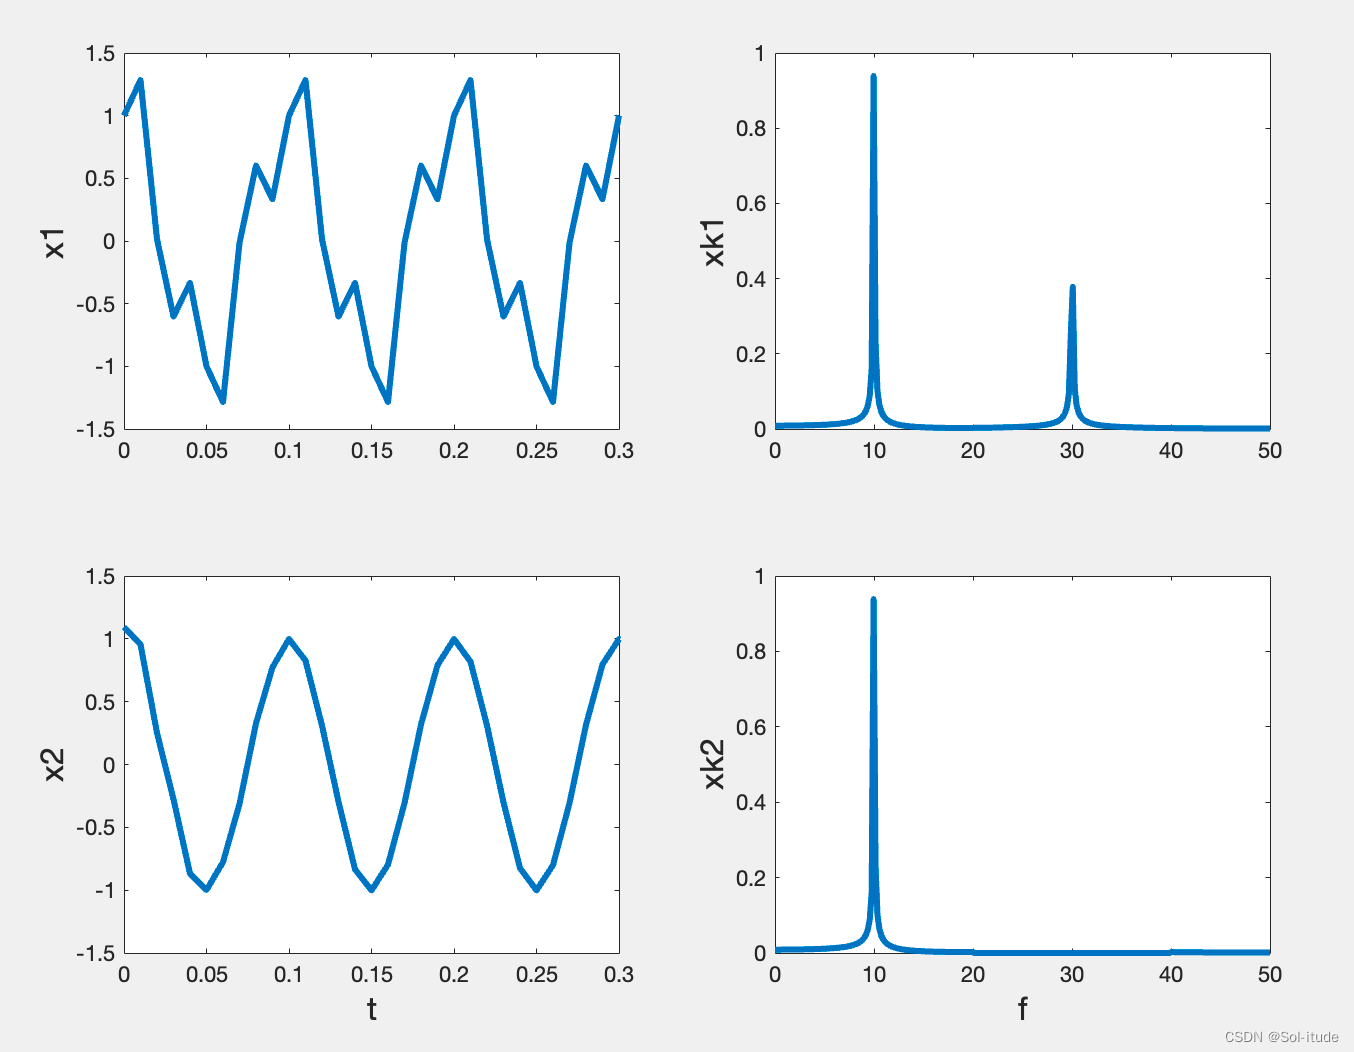
在这里插入图片描述 对x1和x2进行了快速傅立叶变换

评论